E ffects of Sample Contamination on Alternate Allele Frequency
- Research Team
- Roshan Sood
- Investigators
- Jane Gibson
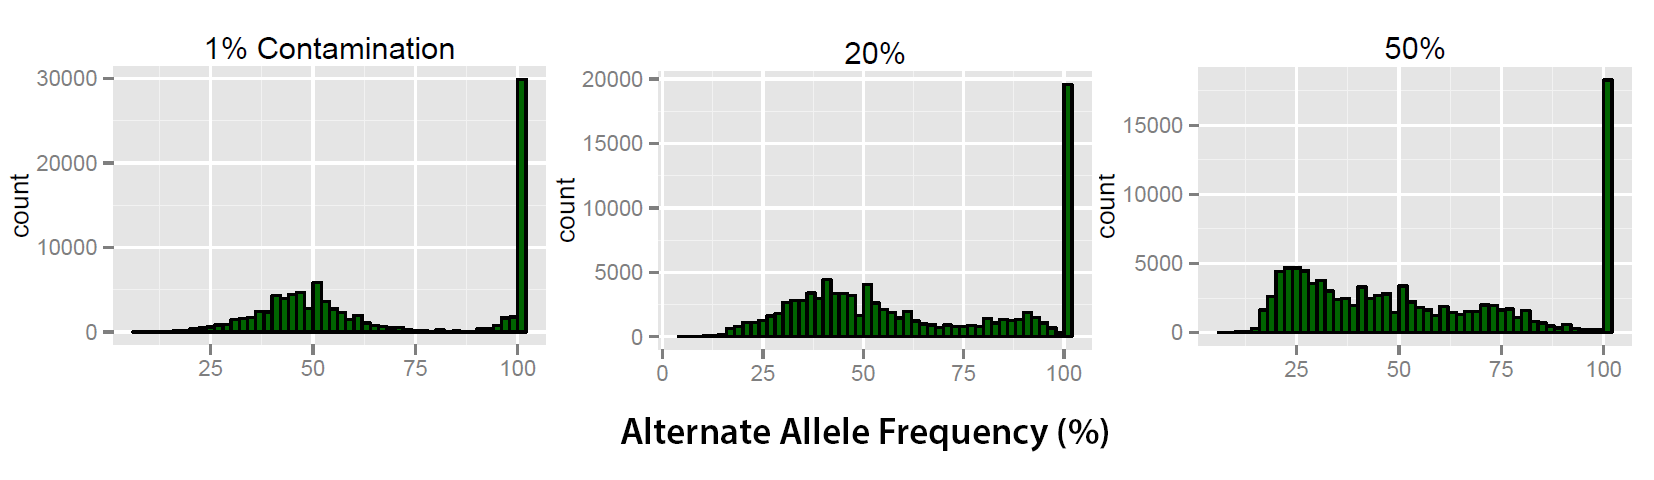
Figure 1: 3 levels of contamination are shown above. As the contamination levels increase the count for the peak at 100 decreases. Also the separation between the peaks (100 and 53%) becomes reduced and a second peak begins to form at around 25%.
Using raw fastq data from 10 whole exome sequenced samples fixed percentages of one file would be swapped with a second file generating a known amount of contamination. Contamination was simulated at levels from 1-50%. Beyond 50% the original sample becomes the contaminating sample. The contaminated raw fastq files were then aligned using Novoalign(V2.08) with human genome reference sequence(hg19). Samtools (V0.1.19) was used to call variants against the reference sequence, resulting in a Variant Call File (VCF) for each sample. The contamination sets were generated for each cross using automating scripts, for each cross including temporary files approximately 750 GB were required.
Each variant has information describing whether it is a heterozygote or homozygote and DP4 values which describe the number of matches to the forward, reverse reference alleles and Non-reference alleles. Writing a small AWK program to extract this information allows the plotting of the alternate allele frequency using R. From uncontaminated samples the average alternate allele frequency for heterozygotes should be around 50% and for homozygotes the alternate allele frequency will be close to 100% as reference homozygotes are not called as variants.
Using these established values as a baseline it is possible to visualise trends in the alternate allele frequency as shown in Figure 1. Trends illustrated in these profi les allow the analysis of how contamination aff ects the classifi cation of heterozygous and homozygote variants. Figure 1 illustrates that at 1% contamination the two peaks ( 50% and 100%) are clearly separated. At 20% contamination the peak at 100% reduces in count and a secondary peak forms at around 95%. When contamination is increased further then the trend becomes exaggerated with a further reduction in the homozygote variant peak at 100% coupled with reduction and the formation of a new peak at around 25%. Currently the simulations are being expanded using a greater number of samples. 182 samples will be used to generate 91 simulations to ensure a program is universally applicable and the trends identifi ed in the initial set are accurate. With this information it is possible to understand the e ffect that sample contamination has and develop a method which exploits these trends to accurately identify levels of sample contamination.
Categories
Life sciences simulation: Bioinformatics, NextGen Sequencing
Software Engineering Tools: RStudio, Vim