Seminar 19th May 2016 6 p.m. Nuffield Theatre Room 1083 (6/1083)
Matplotlib 2.0
Jens Nielsen
UCL
- Web page
- http://southampton-python.github.io/
- Categories
- C, C++, colour perception, Data Science, Design, e-Research, IPython/Jupyter Notebook, NGCM, Python, Scientific Computing, Software Engineering, Surface imaging, Visualisation
- Submitter
- Thomas Kluyver
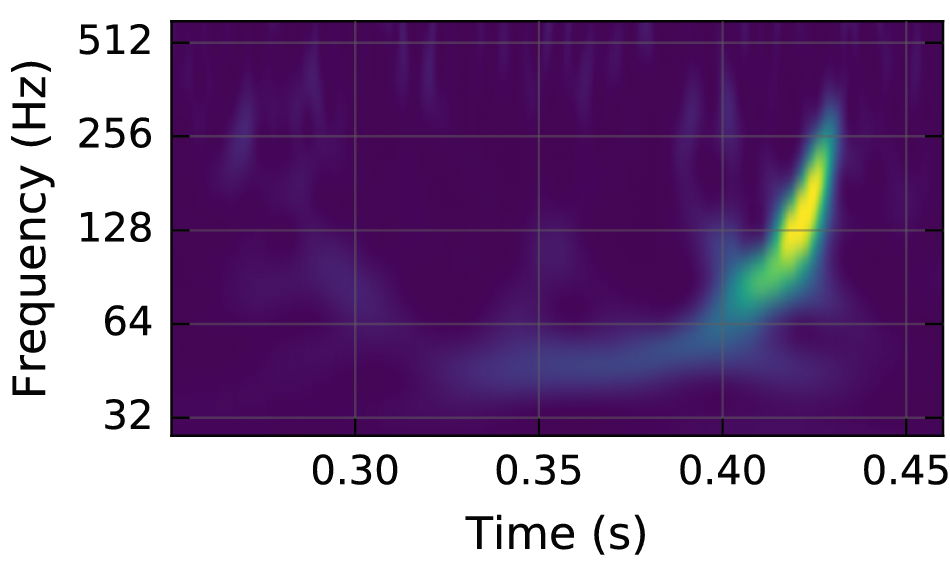
A plot from the LIGO gravitational wave paper, drawn by matplotlib with the new 'viridis' colour map.
Matplotlib is a perhaps the most well established plotting library in the scientific ecosystem. With this follows a commitment to a stable API and visual style.
However, as time has passed it has become more obvious that the Matplotlib default style is looking dated and less than optimal.
In this talk I will look at how we are changing the Matplotlib default style for the upcoming 2.0 release. I will demonstrate the changes and how to use the Matplotlib styles module to easily produce plots with very different styles, including the old Matplotlib 1.x style. I will also take a look at some of the lessons that we learned from changing the style perhaps take a look at other upcoming features in future versions of Matplotlib.
We will also have lightning talks, presentations of no more than five minutes each. The theme is plotting and visualisation. If you'd like to give a lightning talk, please let Thomas Kluyver (t.kluyver@soton.ac.uk) know.
Refreshments will be provided, and everyone will be welcome to come to the pub afterwards.