Supernova Rates in the Local Universe
- Started
- 26th October 2013
- Research Team
- Christopher Frohmaier
- Investigators
- Mark Sullivan
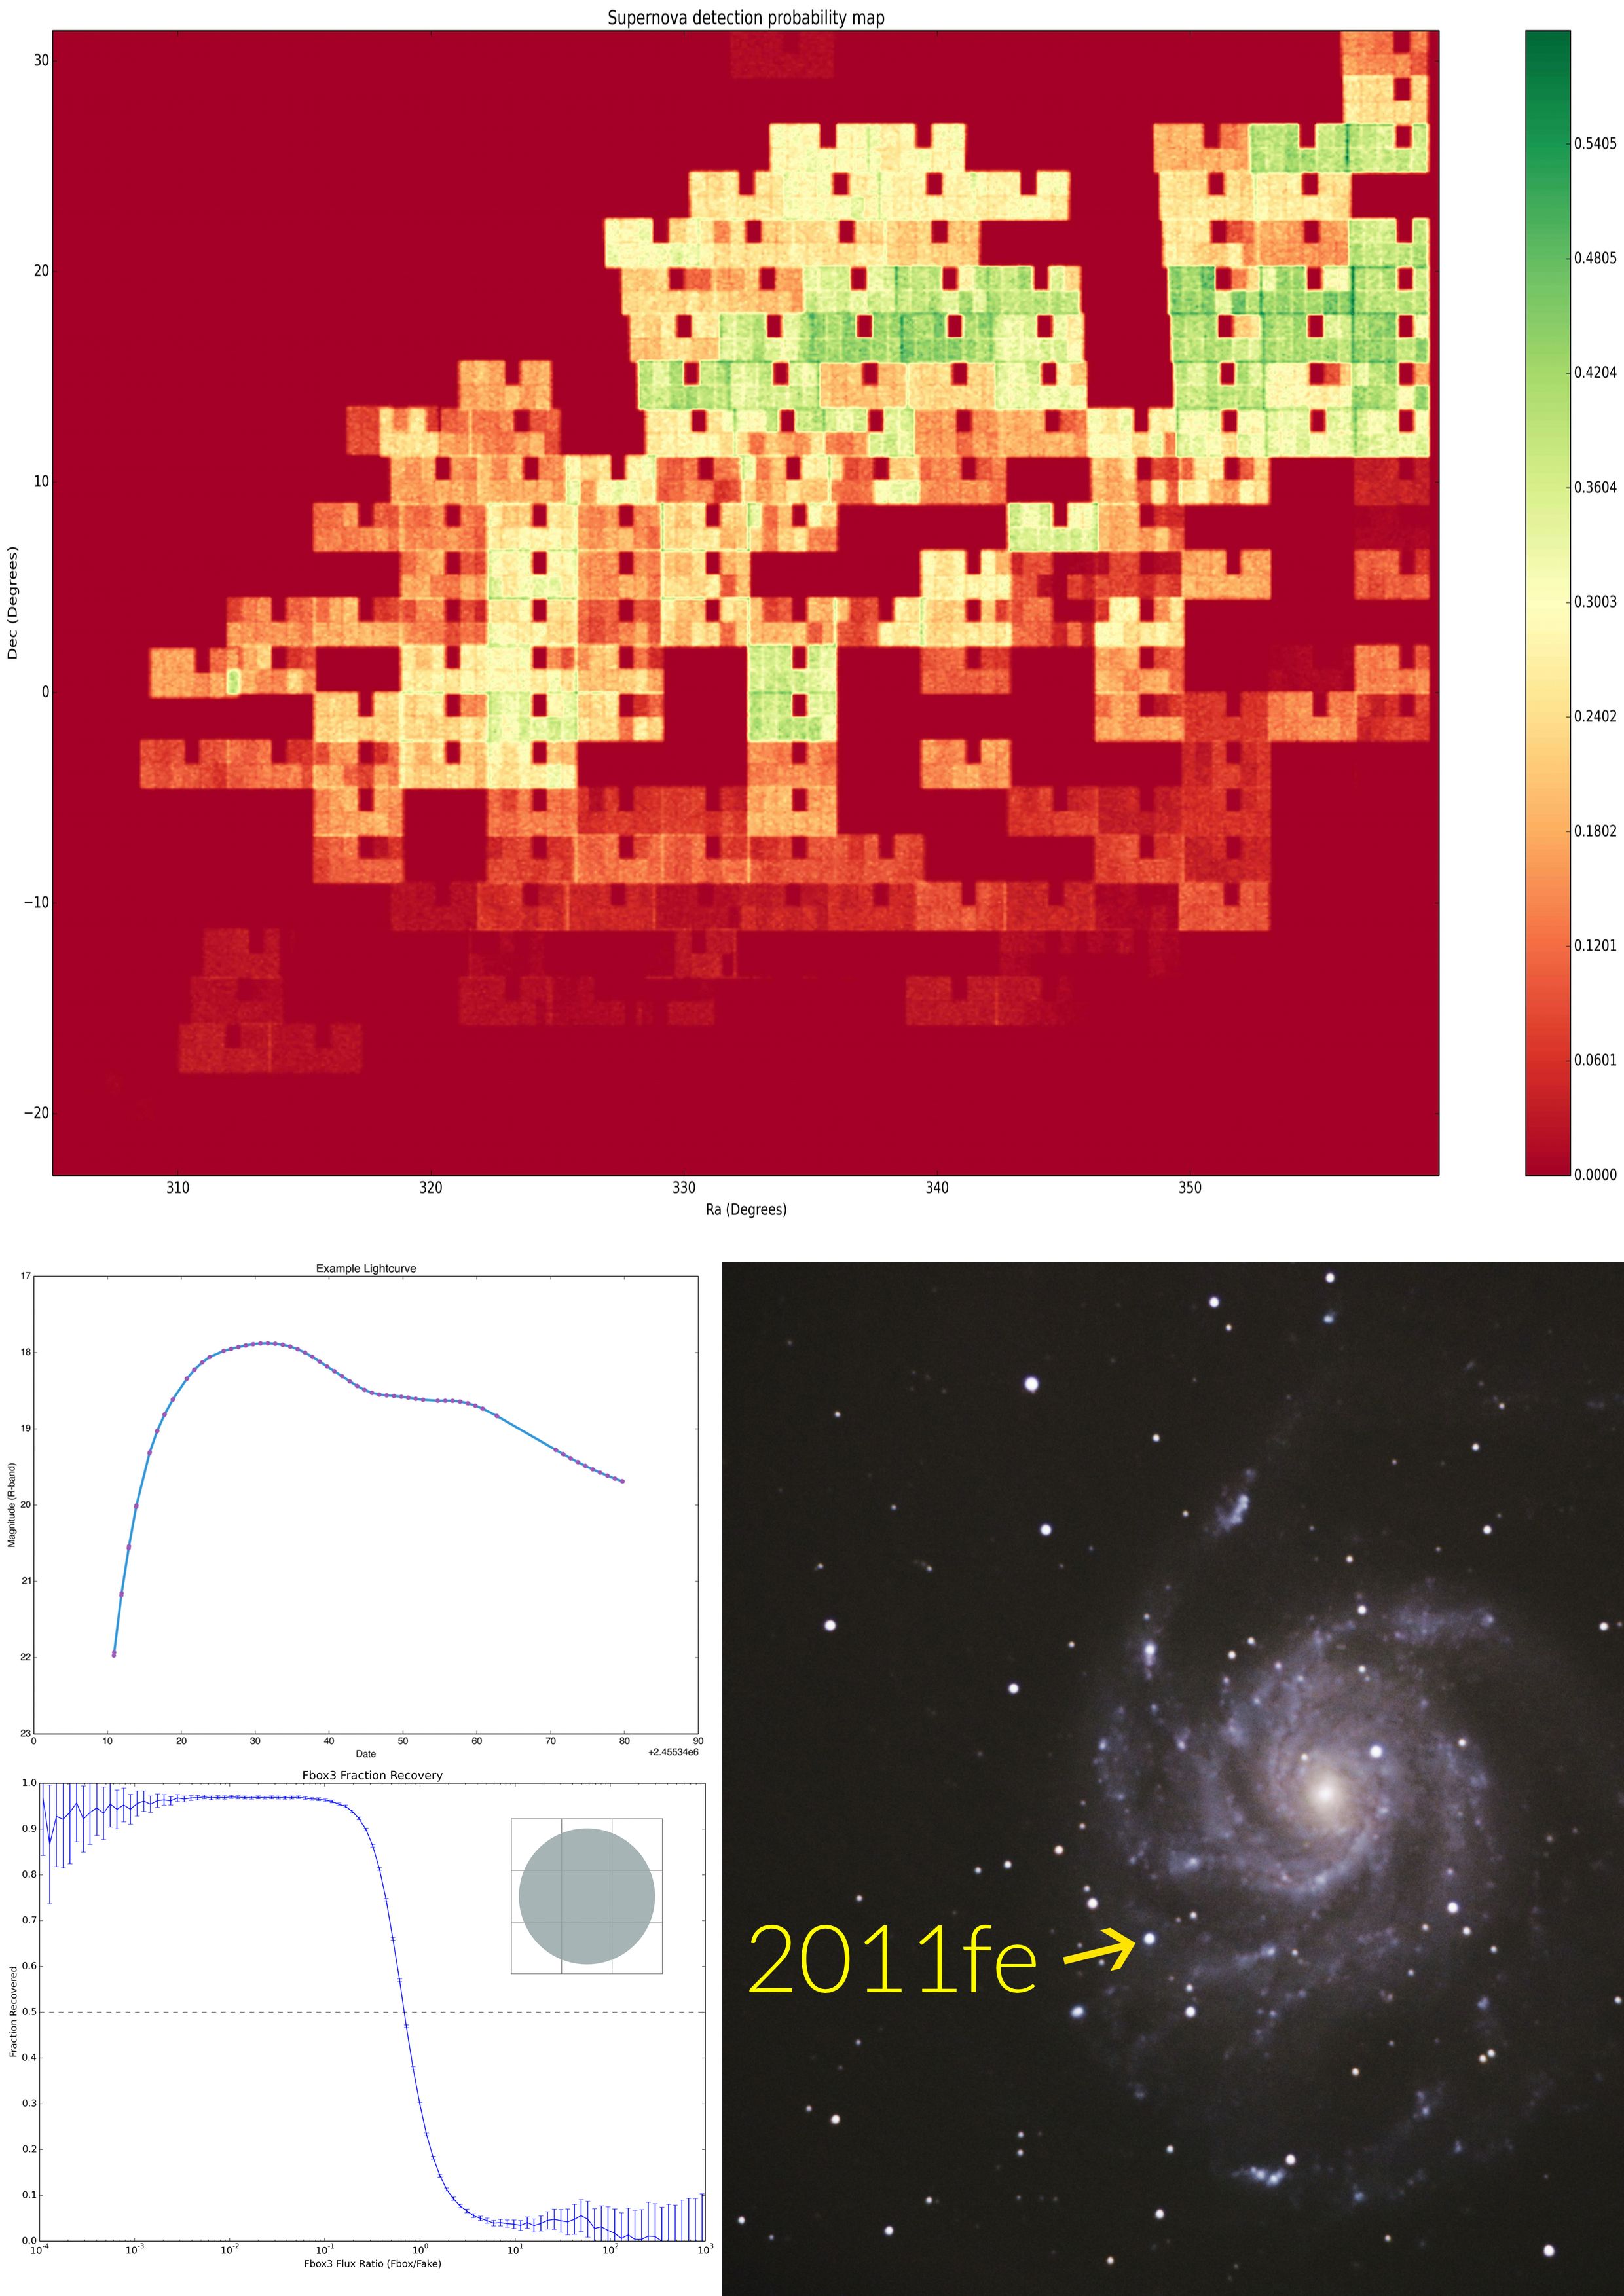
A small area probability map (top), a Type Ia light curve and 1D efficiency plot (left) and PTF's most famous Supernova discovery, 2011fe (bottom right)
Supernovae are extremely luminous stellar explosions showcasing the dramatic endpoint of a star’s life. They have a profound influence on many diverse area of astrophysics: supernovae dominate the heavy element production of the Universe; they govern the chemical evolution of galaxies; their shockwaves can trigger the formation of new stars; and supernovae of type Ia can be used to measure the accelerating expansion of the Universe, a discovery that won the Nobel Prize for Physics in 2011. To fully understand the physics of these events, we need to know how many supernovae explode in a given time frame, the so-called 'Supernova Rate'.
Supernovae can be found by astronomical sky surveys that scan the night sky with the goal of finding new transient objects. We use three years (2010-2012) of data from the Palomar Transient Factory (PTF), the largest unbiased sky survey ever performed, to map the supernova detection probability as a function of position in the local universe. The volume of data produced by PTF is large: >100GB per night for three years. Supernovae are not the only transients found, objects like asteroids, active galactic nuclei and black hole binary outbursts are also detected. However, no survey can be 100% efficient, and many objects are left unclassified. The probability maps we create in our project will weight the real supernovae found by PTF; for example a real supernova with a 20% probability coefficient would represent an actual population of 5 supernovae, with 4 of those events otherwise missed. The ultimate goal of this project is to place the tightest constraint ever on the number of supernovae that explode each year in the local universe.
The night sky is over 40,000 square degrees in area and our survey simulation is performed out to a distance of 1.6 billion light years. This represents a huge volume to simulate explosions in, and so we require the best computational resources available. To achieve our goal we utilise Iridis 4 in a multi-step process:
- A random location in the local universe is chosen.
- A supernova explosion is simulated at that location.
- Model supernovae are used to simulated the physics behind each unique explosion for 70 days.
- The observing conditions for 1.6 million CCD exposures are drawn from a PSQL database.
- We determine if the simulated supernova would have been found by replicating the telescope and weather conditions each night and store these results in the PSQL database.
- We repeat this process for billions of explosions throughout the local universe, requiring efficiency calculations for hundreds of billions of data points.
- We then construct a multidimensional efficiency map of supernovae in the local universe.
With a statistically representative probability map of the local universe, we can add the real supernovae from PTF to weight their detections and calculate a volumetric supernova rate in the local universe. Such a detailed simulation requires the latest HPC technology with the fastest data links available: Iridis 4 has made this project possible.
Categories
Physical Systems and Engineering simulation: Astrophysics
Algorithms and computational methods: Monte Carlo, Multi-core, Multi-physics, statistical analysis
Visualisation and data handling methods: Data Management, Database
Visualisation and data handling software: PostGres, Pylab
Software Engineering Tools: Git, Sublime Text
Programming languages and libraries: OpenMP, Python
Computational platforms: Linux, Mac OS X
Transdisciplinary tags: HPC, Scientific Computing